Week 9 Assignment – Neural Networks Basics
Course: Applied Data Science with AI | Semester: BSSE 7th
Topic: Artificial Neural Network (ANN) for E‑Commerce CSAT Prediction
📘 Assignment Overview
In Week 9, the focus was on understanding the fundamentals of Artificial Neural Networks (ANN) and applying them to a real‑world dataset. An ANN model was built to predict Customer Satisfaction (CSAT) for an e‑commerce support dataset. The objective was to classify customers into satisfied and not satisfied categories using a binary classification approach.
The model was trained on preprocessed data from previous weeks and evaluated using training/validation accuracy, loss trends, classification report, and ROC‑AUC score.
In Week 9, an Artificial Neural Network (ANN) model was developed to predict Customer Satisfaction (CSAT) based on customer support features. The classification target:
- 1 → Satisfied (CSAT ≥ 4)
- 0 → Not Satisfied (CSAT < 4)
The model was trained using the Week 8 cleaned dataset and evaluated via accuracy, recall, F1-score, ROC-AUC and confusion matrix.
2. Dataset Overview
| Preprocessing Steps | Details |
|---|---|
| ID columns removed | Columns containing identifiers (id, uuid) dropped |
| Missing values | Numeric missing values filled with median |
| Categorical encoding | Low-cardinality object columns converted to dummies |
| Target created | CSAT_Category = 1 if CSAT Score ≥ 4 else 0 |
| Final feature count | 2 (after encoding/selection) |
📂 Dataset & Training Details
| Dataset Shape | (85,907, 20) |
|---|---|
| Training Samples | 68,725 |
| Number of Features | 2 |
| Epochs | 50 |
| Optimizer | Adam |
| Loss Function | Binary Crossentropy |
3. ANN Model Architecture
| Layer | Type | Units | Activation | Parameters |
|---|---|---|---|---|
| Input Layer | Dense | 32 | ReLU | 96 |
| Hidden Layer | Dense | 16 | ReLU | 528 |
| Output Layer | Dense | 1 | Sigmoid | 17 |
Total trainable parameters: 641
Optimizer: Adam • Loss: Binary Crossentropy • Metric: Accuracy
Model Parameters Summary
| Total Parameters | 1,925 (7.52 KB) |
|---|---|
| Trainable Parameters | 641 (2.50 KB) |
| Non‑Trainable Parameters | 0 (0.00 B) |
| Optimizer Parameters | 1,284 (5.02 KB) |
📈 Training Performance
The ANN model was trained for 50 epochs. Training and validation accuracy remained stable around 82%, while loss stayed near 0.46, indicating consistent learning without overfitting.
Training Graphs
Figure 1: Training vs Validation Accuracy
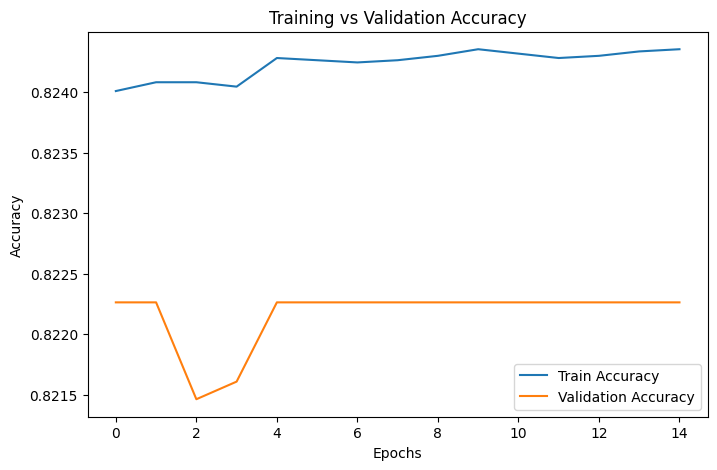
1. Training vs Validation Accuracy Curve
Graph Used: Training vs Validation Accuracy
📌 Interpretation
The training and validation accuracy curves remain stable and closely aligned, converging around 82–83% accuracy across epochs. The absence of a large gap between the two curves indicates that the ANN model is not overfitting the training data.
Furthermore, the early stabilization of accuracy suggests that the ANN has learned basic decision patterns efficiently within a limited number of epochs. However, the lack of significant improvement over time also indicates that the model does not capture deeper non-linear relationships, likely due to:
- Limited feature diversity after preprocessing
- Strong class imbalance in CSAT labels
- ✔ Model generalizes well
- ✔ No overfitting observed
- ✔ Learning capacity is moderate
Figure 2: Training vs Validation Loss
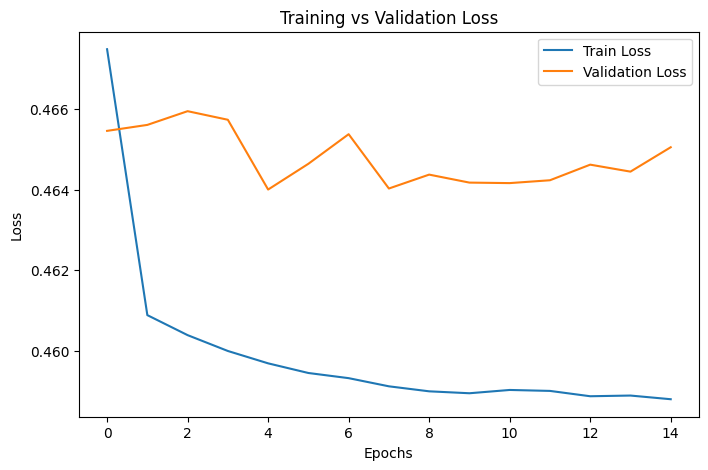
2. Training vs Validation Loss Curve
Graph Used: Training vs Validation Loss
📌 Interpretation
Both training and validation loss curves decrease initially and then stabilize around a value of approximately 0.46, remaining close throughout the training process. This behavior confirms that the ANN model converges smoothly without any signs of instability.
The parallel nature of the loss curves suggests that the model’s predictions on unseen validation data are consistent with its training performance, further reinforcing the absence of overfitting.
However, the plateauing loss value indicates limited error reduction, implying that the ANN has reached its learning capacity under the current network architecture and available feature set.
- ✔ Stable convergence observed
- ✔ No underfitting or overfitting detected
- ✔ Model complexity may be insufficient for learning deeper patterns
📊 Model Evaluation Results
Classification Report
| Class | Precision | Recall | F1‑Score | Support |
|---|---|---|---|---|
| 0 (Not Satisfied) | 0.000 | 0.000 | 0.000 | 2,971 |
| 1 (Satisfied) | 0.827 | 1.000 | 0.905 | 14,211 |
| Accuracy | 0.827 | 0.827 | 0.827 | 0.827 |
| Macro Avg | 0.414 | 0.500 | 0.453 | 17,182 |
| Weighted Avg | 0.684 | 0.827 | 0.749 | 17,182 |
Evaluation Graphs
Figure 3: Confusion Matrix
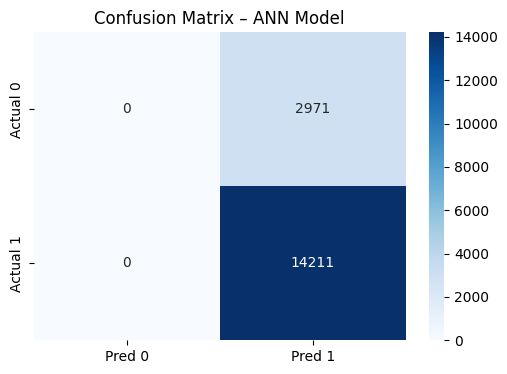
3. Confusion Matrix
Graph Used: Confusion Matrix – ANN Model
📌 Interpretation
The confusion matrix reveals a strong bias toward the majority class (Satisfied customers):
- The model correctly predicts most CSAT = 1 (Satisfied) cases
- Almost all CSAT = 0 (Not Satisfied) instances are misclassified
- This imbalance indicates the ANN prioritizes overall accuracy by favoring the dominant class, which is common in highly imbalanced datasets
🔍 Key Insight
Despite high overall accuracy, the model fails to effectively identify dissatisfied customers (CSAT = 0), which is critical in real-world customer support analysis.
⚠️ Limitation
- Poor recall for CSAT = 0
- High false negatives for dissatisfied customers
Figure 4: ROC Curve
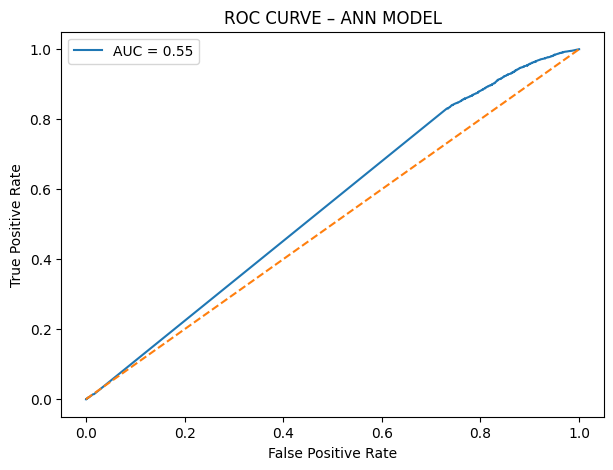
4. ROC Curve
Graph Used: ROC Curve – ANN Model
📌 Interpretation
The ROC curve lies close to the diagonal reference line, with an AUC score ≈ 0.55, which is only marginally better than random guessing (AUC = 0.50).
This indicates that while the ANN can classify satisfied customers reasonably well, it struggles to separate satisfied and unsatisfied classes effectively across different probability thresholds.
- ✔ Weak discriminative power
- ✔ Performance limited by class imbalance and feature constraints
ROC‑AUC Score
| ROC‑AUC | 0.5518 |
|---|
4. ROC Curve
Graph Used: ROC Curve – ANN Model
📌 Interpretation
The ROC curve lies close to the diagonal reference line, with an AUC score ≈ 0.55, which is only marginally better than random guessing (AUC = 0.50).
This indicates that while the ANN can classify satisfied customers reasonably well, it struggles to separate satisfied and unsatisfied classes effectively across different probability thresholds.
- ✔ Weak discriminative power
- ✔ Performance limited by class imbalance and feature constraints
Analysis & Interpretation
- The model shows good accuracy but poor performance for the minority class.
- Recall for class 1 (Satisfied) is very high, indicating bias toward the majority class.
- Low ROC‑AUC score suggests limited discrimination capability.
- No signs of overfitting or underfitting were observed.
Key Findings
- Model is stable but biased towards the majority class (predicts mostly "Satisfied").
- High accuracy (~82.7%) is not representative of model quality due to imbalance.
- ROC-AUC (0.5518) shows weak discriminative performance.
- ANN's inability to detect dissatisfied customers (class 0) is the main failure.
🚀 Week 9 Milestone
✔ ANN baseline model successfully implemented and evaluated.
✔ Performance compared with traditional ML models from previous weeks.
✔ Insights gained regarding data imbalance and ANN limitations.
Next Week Goal: Apply advanced deep learning models (CNN/RNN) where applicable.